April 2022 - Week 3 Edition
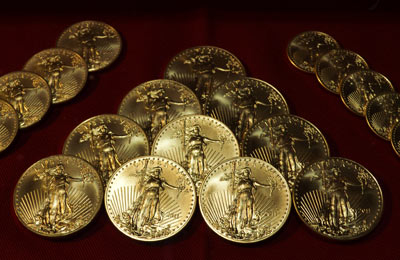
Gold Keeps Bouncing Around $2,000 Mark
Gold touched $2,000 per ounce on Monday morning, April 18, which was “Patriot’s Day” in Boston. The day marks the 247th anniversary of Paul Revere’s ride and the “shot heard ‘round the world” that launched the American Revolution against high British taxes without representation in 1775. It’s also Tax Day this year because the traditional April 15th deadline fell on Good Friday!
Gold rose on the continuing violence in Russia’s war on Ukraine and rising global inflation. At the same time Monday morning, silver topped $26 per ounce, a long-time technical ceiling. Last week, silver rose faster than gold, up 3.9% for the week, mostly on reports of 40-year highs in annual inflation numbers.
Gold ETF Purchases Hit a Record High in March & Goldman Sachs Boosted its Gold Target to $2,500
In March 2022, investor purchases of gold exchange-traded funds (ETFs) and other gold-based products reached a new record high – five times the amount sold in February and eclipsing the previous record peak of $9.4 billion set nearly two years ago in July 2020. Investors generally pulled money last month out of European stocks due to their decline in the wake of Russia’s continued fighting in Ukraine.
Congratulations to Goldman Sachs for being the only major mainstream banker we saw to predict, as I also did in January, prices for gold above $2,000 an ounce. Their initial gold target was $2,150, but well before gold made its latest move to $2,000, Goldman Sachs also predicted gold could reach $2,500 this year IF gold ETF purchases increased dramatically. Now, that we have seen ETF sales surge in March, Goldman, in early April, made $2,500 official and raised their target price for gold in 2022 to $2,500 by year-end.
At the beginning of the Russia-Ukraine conflict in February, Goldman Sachs predicted a general boom in commodities, including gold, saying that the conflict could “push gold ETF inflows to 600 tons and, in turn, push the gold prices to $2,350 an ounce in 12 months.” This scenario, they now say, is their “base case,” so Goldman Sachs analysts Mikhail Sprigis, Sabine Schels and Jeffrey Currie have raised their 3-month target (July) to $2,300, and their 6-month target (October) to $2,500, as of their latest release.
(Note: One metric ton of gold equals 32,150 Troy ounces, or one million grams of gold. At $2,000 per Troy ounce, one metric ton would be worth $64,300,000. Therefore, $9.4 billion in gold ETFs would be equal to 146 metric tons of gold. Goldman’s prediction of gold ETF demand of 600 tons would be for the full-year demand. The previous record full-year net in-flows into gold ETFs was 877 tons in 2020).
Inflation Alert! The “Tooth Fairy Index” is Up 45% Since 2019
We all have our favorite market indicators. At coin shows, I like to watch for tennis shoes and pizza boxes. When the coin market is “hot,” dealers are on their feet all day, so they often wear comfortable shoes at their booths, and more order out for pizza instead of a two-hour, two-drink lunch. When it comes to inflation, there are many indicators, but a real “family-friendly” inflation index I like is the “Tooth Fairy” index, and the poll is quite accurate.
Based on a scientifically representative sample of 1,000+ parents of children ages 6-12, the poll is taken in January and published in February. The margin of error is only +/- 3%. It is sponsored by the Delta Dental plan – for obvious reasons, to promote dental hygiene – but the results are quite amazing.
Here are the results of their last four polls, taken before, during and after – hopefully – COVID:
Average Price the “Tooth Fairy” Pays for a Tooth Under the Pillow
The infusion of cash from the Federal Reserve was so strong in the two COVID years that the Tooth Fairy gave double-digit increases in both years for a combined 45% gain ($3.70 to $5.36) in the last three years. In the same three years, gold gained about the same amount, rising from $1,287 to $1,820, or +41%, but updated for the latest surge to near $2,000, gold has surpassed the Tooth Fairy with a three-year 55% rise.
According to Delta Dental, “The newly disclosed value of a lost tooth has more than quadrupled since the inception of the Original Tooth Fairy Poll® when the value of a lost tooth was $1.30.” That was 1998, when gold was $287, so gold has grown 7-fold in 24 years while the Tooth Fairy index is up 4-fold.
“As a welcomed visitor into most homes around the country, the Tooth Fairy continues to bring fun and excitement to kids’ oral health care awareness. In fact, 1 in 5 parents share that the Tooth Fairy was one of their child’s favorite surprises during the pandemic,” said André Richards, Assistant Vice President of Delta Dental Plans Association. “With this year’s Delta Dental-sponsored national poll reflecting double-digit growth in Tooth Fairy giving, perhaps the Tooth Fairy is experiencing the effects of inflation, along with being very generous.” Here’s a breakdown by region. The West clearly has some catching up to do.
U.S. Regional Giving by the Tooth Fairy
- $7.36 — The Northeast: Continues to lead U.S. regions in highest average monetary gift for a lost tooth, rocketing $2 above the national average, and a $1.64 gain over the previous year.
- $5.77 — The South: Tracking most closely to the overall U.S. average (and a $1.32 increase).
- $4.27 — The Midwest: Although lower than the national average, it is up 61 cents in a year.
- $4.08 — The West: Represents the only U.S. region with a downward giving trend, down $1.46.
Important Disclosure Notification: All statements, opinions, pricing, and ideas herein are believed to be reliable, truthful and accurate to the best of the Publisher's knowledge at this time. They are not guaranteed in any way by anybody and are subject to change over time. The Publisher disclaims and is not liable for any claims or losses which may be incurred by third parties while relying on information published herein. Individuals should not look at this publication as giving finance or investment advice or information for their individual suitability. All readers are advised to independently verify all representations made herein or by its representatives for your individual suitability before making your investment or collecting decisions. Arbitration: This company strives to handle customer complaint issues directly with customer in an expeditious manner. In the event an amicable resolution cannot be reached, you agree to accept binding arbitration. Any dispute, controversy, claim or disagreement arising out of or relating to transactions between you and this company shall be resolved by binding arbitration pursuant to the Federal Arbitration Act and conducted in Beaumont, Jefferson County, Texas. It is understood that the parties waive any right to a jury trial. Judgment upon the award rendered by the Arbitrator may be entered in any court having jurisdiction thereof. Reproduction or quotation of this newsletter is prohibited without written permission of the Publisher.